QESuite brings the most commonly used statistical anlysis tools of Minitab into Excel.

Capability Analysis

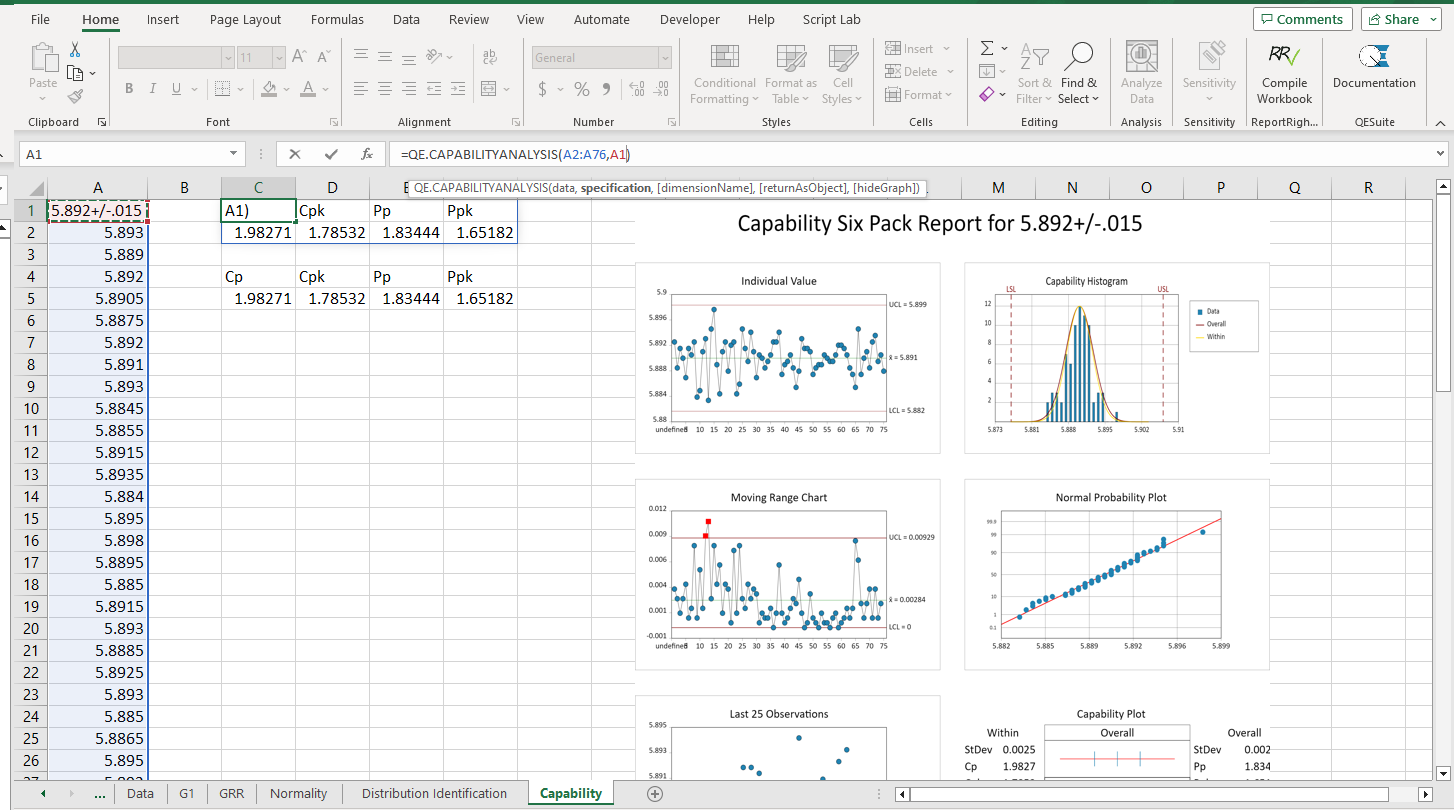
All four capability indices:

  • Cp
  • Cpk
  • Pp
  • Ppk

Capability Six Pack Report includes:

  • Individual Value Plot
  • Capability Histogram (Overall and Within)
  • Moving Range Chart
  • Normal Probability Plot
  • Last 25 Observations Chart
  • Capability Plot (Overall and Within)
Capability Six Pack and Capability Indices in Excel.png
Normality Assessment and Probability Plots in Excel.png Individual Distribution Identification and Goodness-of-Fit in Excel.png
Normality Assessment and Distribution Identification

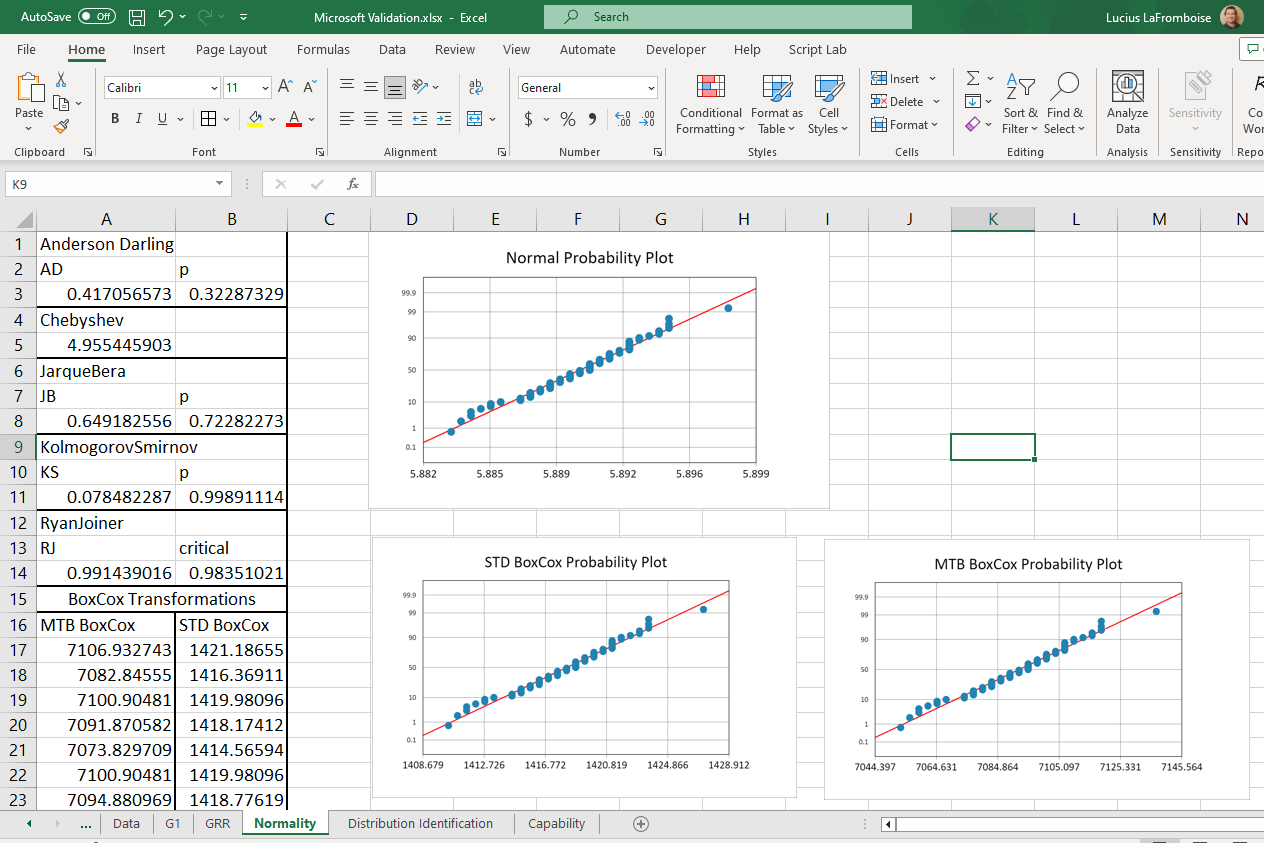
Four tests for Normality:

  • Anderson-Darling
  • Jarque-Bera
  • Kolmogorov-Smirnov
  • Ryan-Joiner

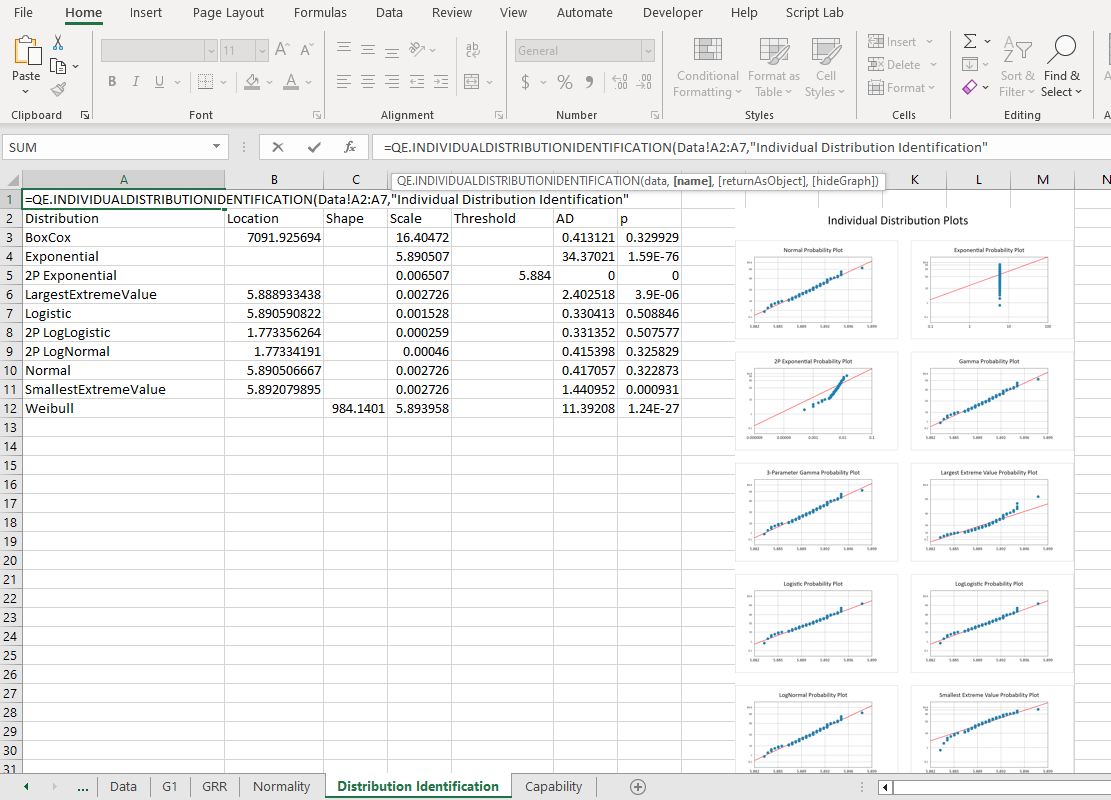
Goodness-of-Fit and Probability Plots for 10 common distributions:

  • BoxCox Transformation
  • Exponential Distribution
  • 2 Parameter Exponential Distribution
  • Largest Extreme Value Distribution
  • Logistic Distribution
  • Loglogistic Distribution
  • 2 Parameter Loglogistic Distribution
  • 2 Parameter Lognormal
  • Normal Distribution
  • Smallest Extreme Value Distribution
  • Weibull Distribution
Measurement Systems Analysis

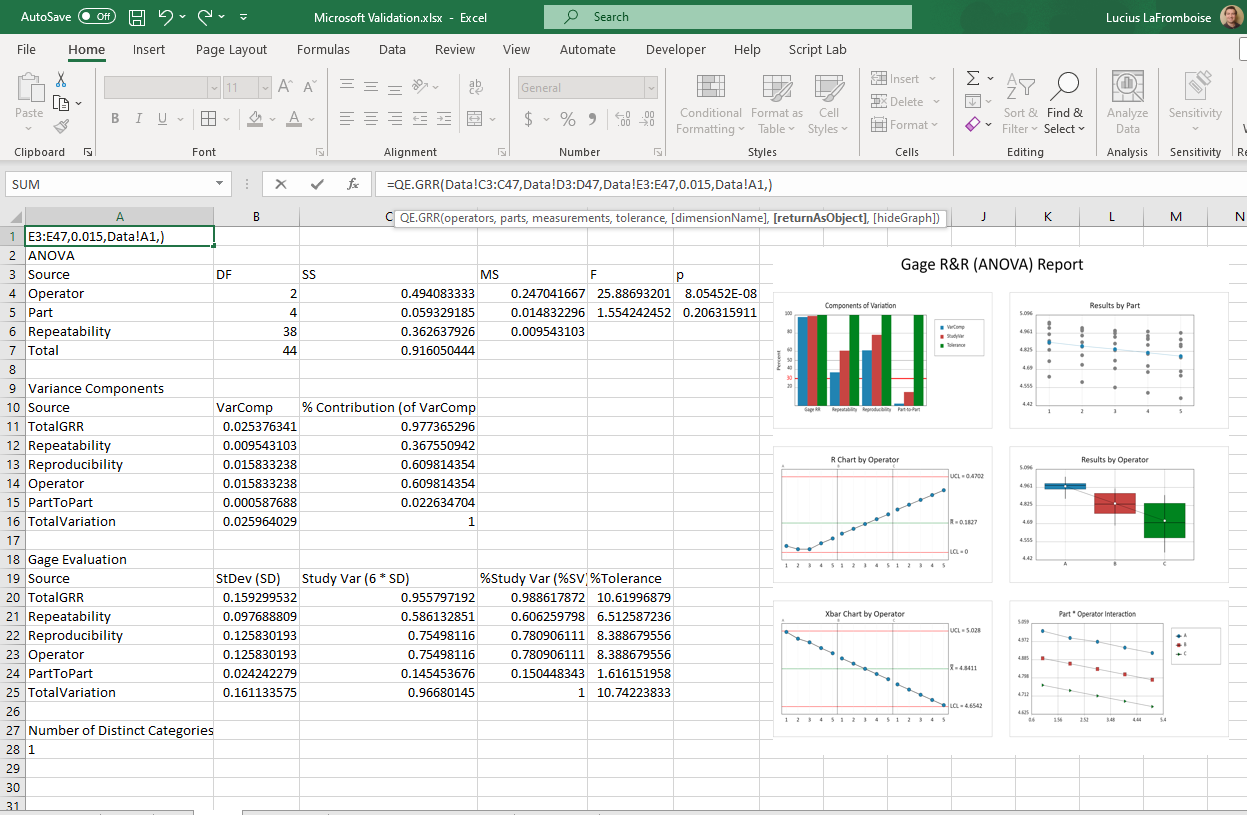
ANOVA Gage R&R (GRR):

  • Two-way ANOVA Table (with/without interaction)
  • Variance Components
  • Gage Evaluation
  • Number of Distinct Categories

GRR Charts Report includes:

  • Components of Variation
  • Results by Part
  • R Chart by Operator
  • Results by Operator
  • Xbar Chart by Operator
  • Part*Operator Interaction Chart
Gage R&R (GRR) Chart in Excel.png